by Christian Buil
The Solar Explorer - October 18 2024

by Christian Buil
The Solar Explorer - October 18 2024
A bit of instrumental theory...
If you're not a fan of mathematics, feel free to skip this section — it won't stop you from building and using Sol'Ex! For those interested, here’s a quick explanation of the design choices behind this instrument, its configuration, and its performance.
Although Sol'Ex is a spectroheliograph, it primarily functions as a spectrograph, meaning it’s an instrument that splits light into its wavelengths, or "colors," if you prefer. For Sol'Ex, I opted for a classic yet reliable optical arrangement — a tried-and-true choice!
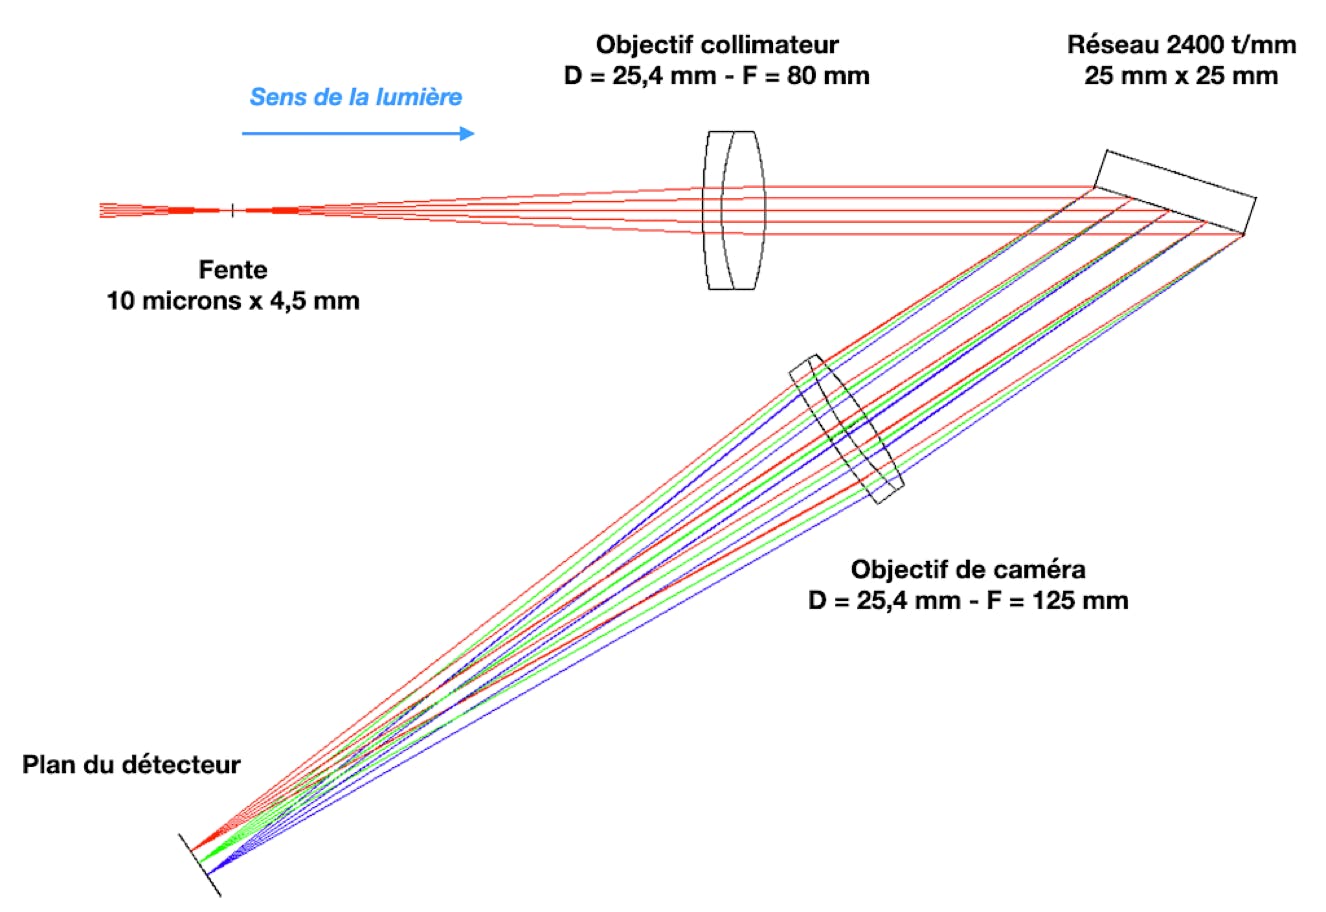
The optical layout of Sol'Ex is shown in the figure below:

The instrument includes at the origin a narrow entrance slit, 10 microns wide and 4.5 mm high, placed at the focus of the observation telescope. Next, an 80 mm focal length collimator objective made of two bonded lenses makes the light rays parallel after passing through the slit. These rays then encounter a 2400 lines/mm holographic diffraction grating, which disperses the light according to its wavelengths. Finally, a 125 mm focal length lens focuses all rays onto the detector plane (the camera objective).
Before and after the grating, the rays form a "V" shape with an internal angle of 34°, known as the "total angle," which gives Sol'Ex its distinctive form.
The light rays from the collimator strike the grating at a high incidence angle of about 72° when observing the hydrogen H-alpha line (656 nm wavelength). This steep angle of incidence results in some vignetting of the light collected by the telescope, due to the limited size of the grating (designed to reduce cost and bulk). In the dispersion plane (as illustrated), the accepted aperture is about f/10.6; perpendicular to this plane, considering the field covered by the slit, the aperture is about f/5.6.
To clarify, let’s imagine using a telescope with a 65 mm diameter and a 420 mm focal length. This gives it an aperture ratio of roughly 420 / 65 ≈ 6.5. In theory, when this telescope is used with Sol'Ex, its effective aperture becomes f/6.5 in the axis perpendicular to the incidence plane (limited by the telescope's aperture) and f/10.5 in the incidence plane (limited by Sol'Ex). If we could illustrate the effective entrance surface, it would appear elliptical rather than circular.
This design does cause some flux loss, as the telescope’s objective is effectively stopped down (unless using a telescope with a native f/10 aperture). However, this loss is negligible in solar observation due to the abundance of available light. Telescopes and camera lenses with apertures between f/5.6 and f/9 work well with Sol'Ex without a noticeable effect on images. For highly open instruments, you may experiment with different aperture stops at the entrance to reduce the opening and potentially improve image quality. Examples are provided in the "Observation" section. For instance, with a photographic lens at f/2.8, stopping it down to f/6 or even f/7 is recommended (diffraction remains insignificant regarding Sol'Ex’s characteristics in this case).
Although the high incidence angle on the grating slightly reduces the light flux, it significantly improves the sharpness of the recorded spectrum. To understand this effect, simply note the difference in beam size in the incidence plane before and after the grating (respectively D1 and D2):

This characteristic specific to the use of a grating is called anamorphosis. In addition to influencing the size of the light beams before and after the grating, anamorphosis also alters the size of the slit’s image on the detector. The width of this image is reduced by a factor of D1/D2, known as the anamorphic factor, while its size along the spatial axis (perpendicular to the dispersion axis) remains unchanged. To illustrate this effect, the following image shows an optical fiber temporarily replacing the Sol’Ex slit: initially circular, the fiber’s final image appears oval-shaped.

Appearance as a few monochromatic images of an optical fiber arranged at the entrance of Sol’Ex for wavelengths close to the H-alpha line.
Anamorphosis, by optically reducing the width of the slit, has a significant impact on the spectral resolution power of Sol’Ex, allowing for the revelation of more details in the spectrum. This effect is particularly beneficial for Sol’Ex, contributing to its high performance despite its compact size.
Practical Calculations
Let’s start with a formula that relates the total angle G (in Sol’Ex, G=34°) and the angle of incidence α on the grating:

With k, the order of diffraction (here k=1), m, the groove density (here m=2400lines/mm), and λ0, the wavelength at the center of the sensor (here 0.6563×10⁻³ mm). Furthermore, G=α−β, where β is the angle of diffraction.
For the observation of the H-alpha line (6563 Å) and adopting the total angle of 34°, the angle of incidence of the rays on the grating is precisely α=72.4°, while the angle of diffraction (after the grating) is β=38.4°. The anamorphic factor is given by the formula:

The width of the entrance slit is effectively reduced optically to 0.386×10microns=3.86microns. This result leads to an increase in spectral resolution. It should be noted that for the red hydrogen line, as well as a large part of the visible spectrum, the optics of Sol’Ex are nearly limited by diffraction, meaning they perform very well (as long as we are not simultaneously exploring a very broad spectral range).
Now, let's calculate the resolution power.
The resolution power is defined by the formula R = λ / Δλ. Δλ is the finest detail observed in the spectrum in units of wavelength. It is noteworthy that R is a dimensionless number. The larger R is, the smaller the details we can observe in the spectrum. We have:

As we have seen, α and β are the angles of incidence and diffraction on the grating, respectively. Moreover, fc is the focal length of the collimator, here fc = 80 mm, and w is the physical width of the slit, here w=10microns=0.010mm. The phenomenon of anamorphosis is described by the term in parentheses of this formula, as well as the impact of the grating density. Let’s calculate around the H-alpha line:

Taking into account the residual optical aberrations, we can consider that the resolution power of Sol’Ex is close to R=40000, which is a remarkable performance for a compact instrument. This yields a spectral resolution of Δλ=λ/R=6563/40000=0.16 A, narrower than that of much more expensive interference filters.
Spectral Dispersion and Sampling
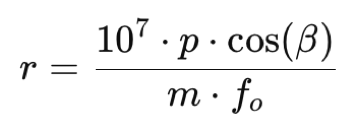
The spectral dispersion parameter, denoted by r, which is expressed here in Å / pixel, is given by:

with p the pixel size in millimeters, and fo, the focal length of the camera lens, which in this case is fo=125mm. For a sensor such as the Sony IMX178, for example, the pixel size is 2.4 microns, and,

It is important to compare the spectral resolution element, Δλ, calculated previously as 0.16 Å, with the spectral sampling of the pixels on the detector, which is 0.063 Å/pixel. This gives 0.16 / 0.063 ≈ 2.53 pixels per resolution element, meaning that we are above the Shannon (or Nyquist) limit, which requires at least two sample points per resolution element. This configuration is well-suited for Sol'Ex. Note that if the IMX178 sensor is used with 2x2 binning (equivalent to 4.8-micron pixels), the Shannon criterion is no longer met, resulting in information loss. For applications that require high precision (such as Doppler measurements), it is preferable to use a camera with small pixels and to operate in 1x1 binning mode whenever possible.
Copyright (C) 2020-2025 Christian Buil
Web : www.astrosurf.com/buil