specINTI & specINTI Editor
10 : The infrared spectrography
The Star'Ex spectrograph has many configurations, from low resolution to high spectral resolution. The possibility to choose the grating and the slit width is at the origin of many possibilities. Among these, there is the (near) infrared observation. This is an opportunity to show new possibilities offered by specINTI.
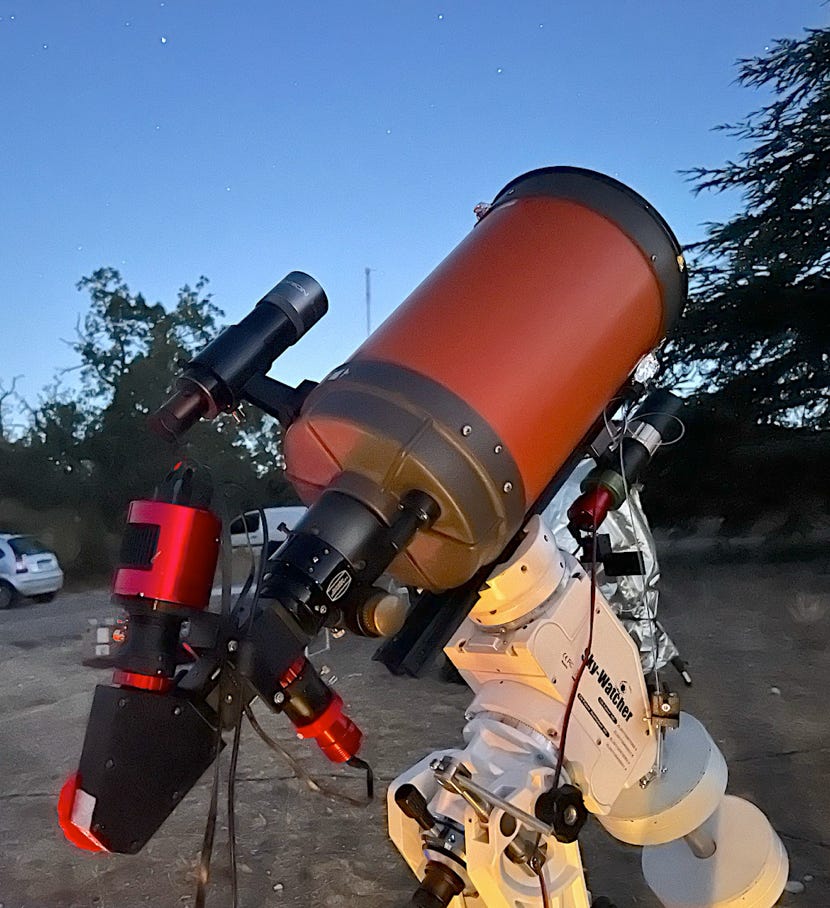
The Star'Ex spectrograph is configured with a 300 lines/mm grating blazed in the infrared, at the wavelength of 1 micron. The blaze refers to the wavelength of the radiometric efficiency maximum of the diffraction grating (specifically, the wavelength of the peak diffraction efficiency when the angles of incidence and diffraction are equal). The 80 mm camera lens used is specially optimized for infrared. It is directly interchangeable with the 80 mm lens optimized for the visible part of the spectrum (these two lenses are part of the Shelyak offer, see here the constitution of the optical kits). The slit is 23 microns wide, and in front of it is inserted a filter of order cutting the wavelengths shorter than 5900 A (OG590). This filter avoids that the visible spectrum of order 2 overlaps the infrared spectrum observed at order 1.
The set is mounted at the back of a Celestron 8 telescope - see opposite.
The document below shows in the upper part two representations of the image of the spectrum of the star HD 4915, of a spectral type very close to that of the Sun, taken with the equipment previously described. Some stellar lines and telluric bands are identified (in red). At the bottom of the same document, there is an image of the spectrum of a neon lamp (placed at the front of the telescope, see section 5.3), with the identification of some lines that can be used for the spectral calibration in the infrared.
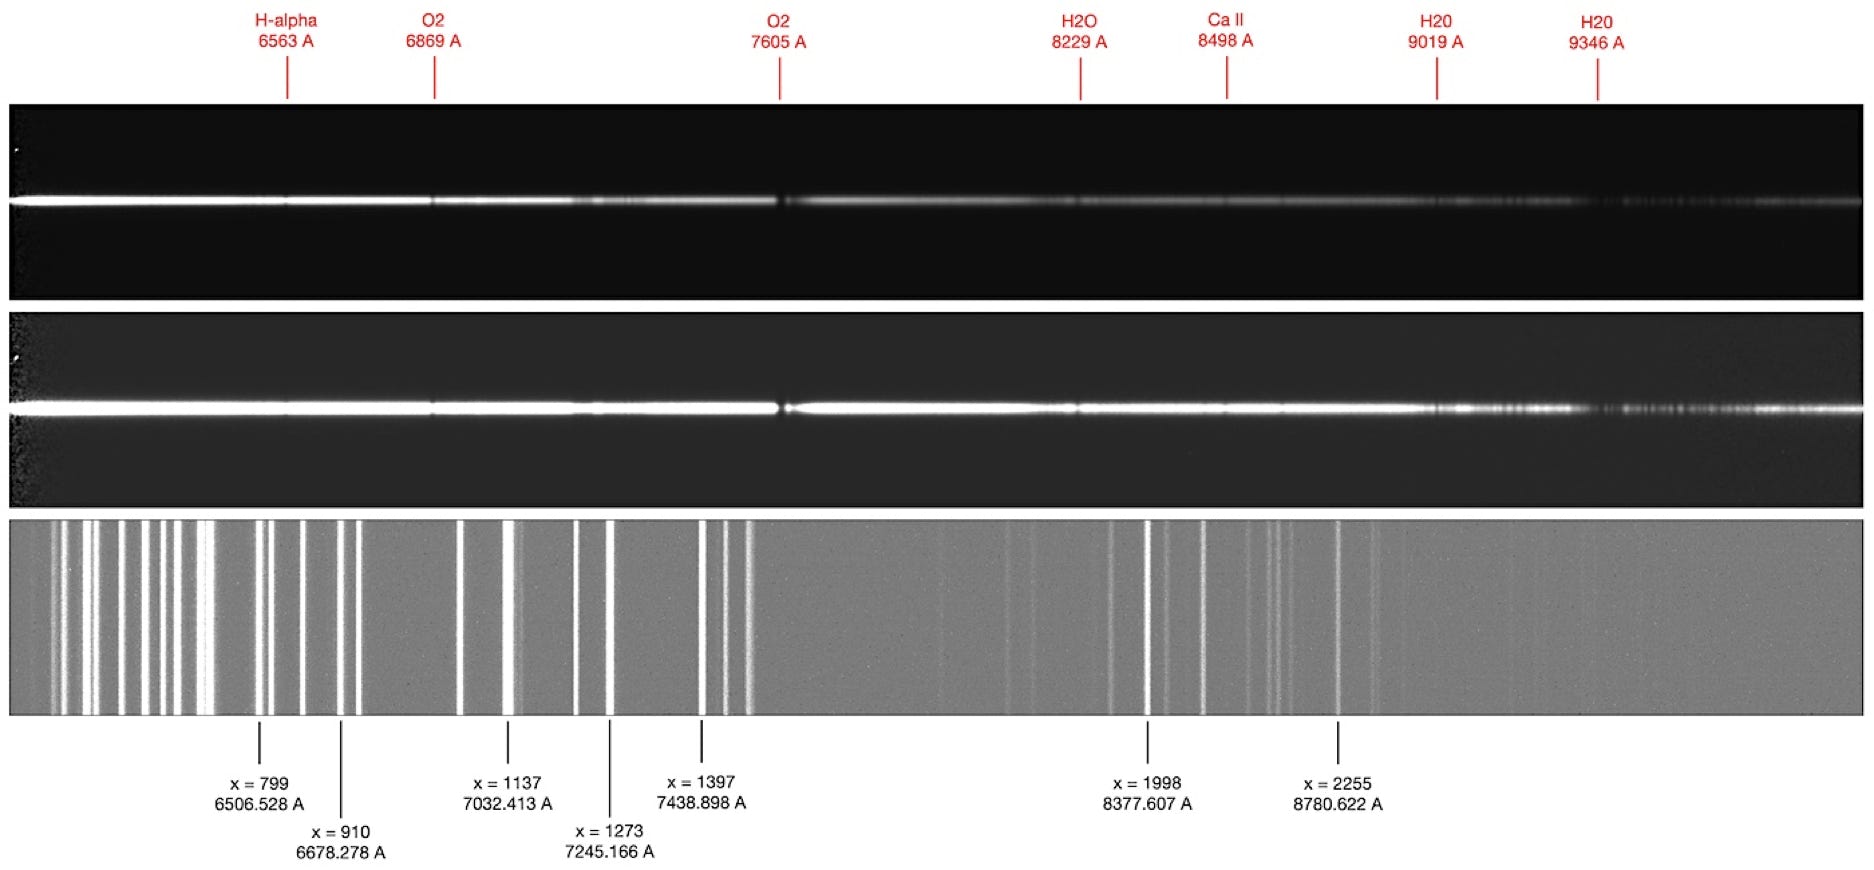
Precisely, the calibration law found here is a polynomial of degrees 2 (sufficient for the infrared part of the spectrum) evaluated with the tool associated with the parameter "calib_mode" taking the value -2 and exploiting the couples :
line_pos: [799, 910, 1137, 1273, 1397, 1998, 2255]
wavelength: [6506.528, 6678.278, 7032.413, 7245.166, 7438.898, 8377.607, 8780.622]
The procedure for finding the calibration coefficients is in all respects similar to that implemented in Section 7.7 (see the corresponding configuration file). The coefficients of the polynomial calculated in this case are :
calib_coef: [1.6550775448678668e-06, 1.5562668769666603, 5264.254271956993]
For the actual reduction of the spectrum of the HD 4915 star (and of the following objects, we will understand why later), we chose to give the "calib_mode" parameter the value 1. This is the most basic technique: specINTI trusts only the terms of the polynomial provided through the "calib_coef" parameter to calibrate our wavelength spectrum. Here is an extract of the configuration file used in this case:
# ********************************************************************
# Sol'EX 300 t/mm IR configuration (new obj) - C8 - 23 micron slot
# Calibration mode 1
# ********************************************************************
# ----------------------------------------------------------------
# Working directory
# ----------------------------------------------------------------
working_path: D:/starex212
# ----------------------------------------------------------------
# Processing batch file
# ----------------------------------------------------------------
batch_name: obs_HD4915
# ----------------------------------------------------------------
# Spectral calibration mode
# ----------------------------------------------------------------
calib_mode: 1
# ----------------------------------------------------------------
# The dispersion polynomial
# ----------------------------------------------------------------
calib_coef: [1.6550775448678668e-06, 1.5562668769666603, 5264.254271956993]
# ----------------------------------------------------
# We provide the wavelength of an intense line in the spectrum of the calibration source to be able to find the angle of slant
# ---------------------------------------------------
line_pos: [1137]
# ----------------------------------------------------------------
# Power of resolution
# ----------------------------------------------------------------
power_res: 900
# ----------------------------------------------------------------
# Binning width
# ----------------------------------------------------------------
bin_size: 20
# ----------------------------------------------------------------
# Sky background calculation areas
# ----------------------------------------------------------------
sky: [150, 20, 20, 150]
# ---------------------------------------------------
# Sky extraction mode
# ---------------------------------------------------
sky_mode: 0
# ----------------------------------------------------------------
# x-terminals for geometric measurements
# ----------------------------------------------------------------
xlimit: [900, 1600]
# ----------------------------------------------------------------
# Name of the instrumental response file
# ----------------------------------------------------------------
instrumental_response: _rep
# ----------------------------------------------------------------
# Color temperature of the tungsten lamp (flat-field realized on table)
# ----------------------------------------------------------------
planck: 2900
# ----------------------------------------------------------------
# Median filter pattern
# 0: no filtering, otherwise: 3, 5, ...
# Negative value: optimized for impulse noise
# ----------------------------------------------------------------
kernel_size: -3
# ----------------------------------------------------------------
# Gaussian filtering
# ----------------------------------------------------------------
sigma_gauss: 0.8
# ----------------------------------------------------------------
# Unit normalization area
# ----------------------------------------------------------------
norm_wave: [7800, 7850]
# ----------------------------------------------------------------
# Profile cropping area
# ----------------------------------------------------------------
crop_wave: [6000, 9900]
Note : we notice the presence of the parameter "line_pos", only here to designate the horizontal coordinate of a line in emission from which specINTI will find geometric parameters of the spectrum. Even in calibration mode #1 it is therefore necessary to have observed the spectrum of a calibration lamp. We note again the appearance of the "power_res" parameter, which becomes mandatory in this calibration mode and which specifies the approximate estimated value of the spectrograph in the conditions of use. The rest should now be well known.
Here is the reduced spectrum of the star HD 4915 in this way :
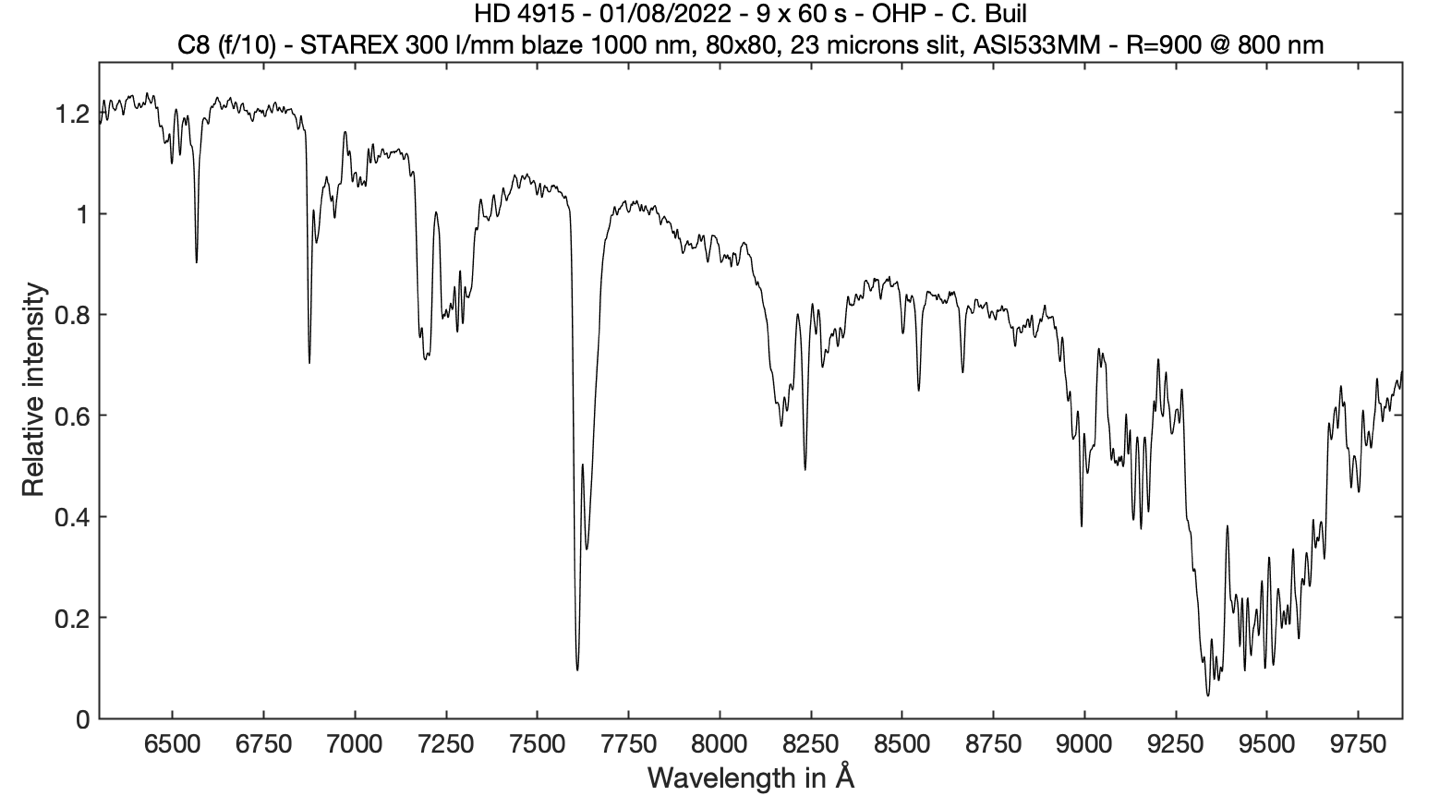
Note that in the infrared, our atmosphere severely absorbs the light of the star, especially around 950 nm (H2O).
During the same session, we observed the spectrum of the planet Jupiter. Here is a computer screen shot during this session:
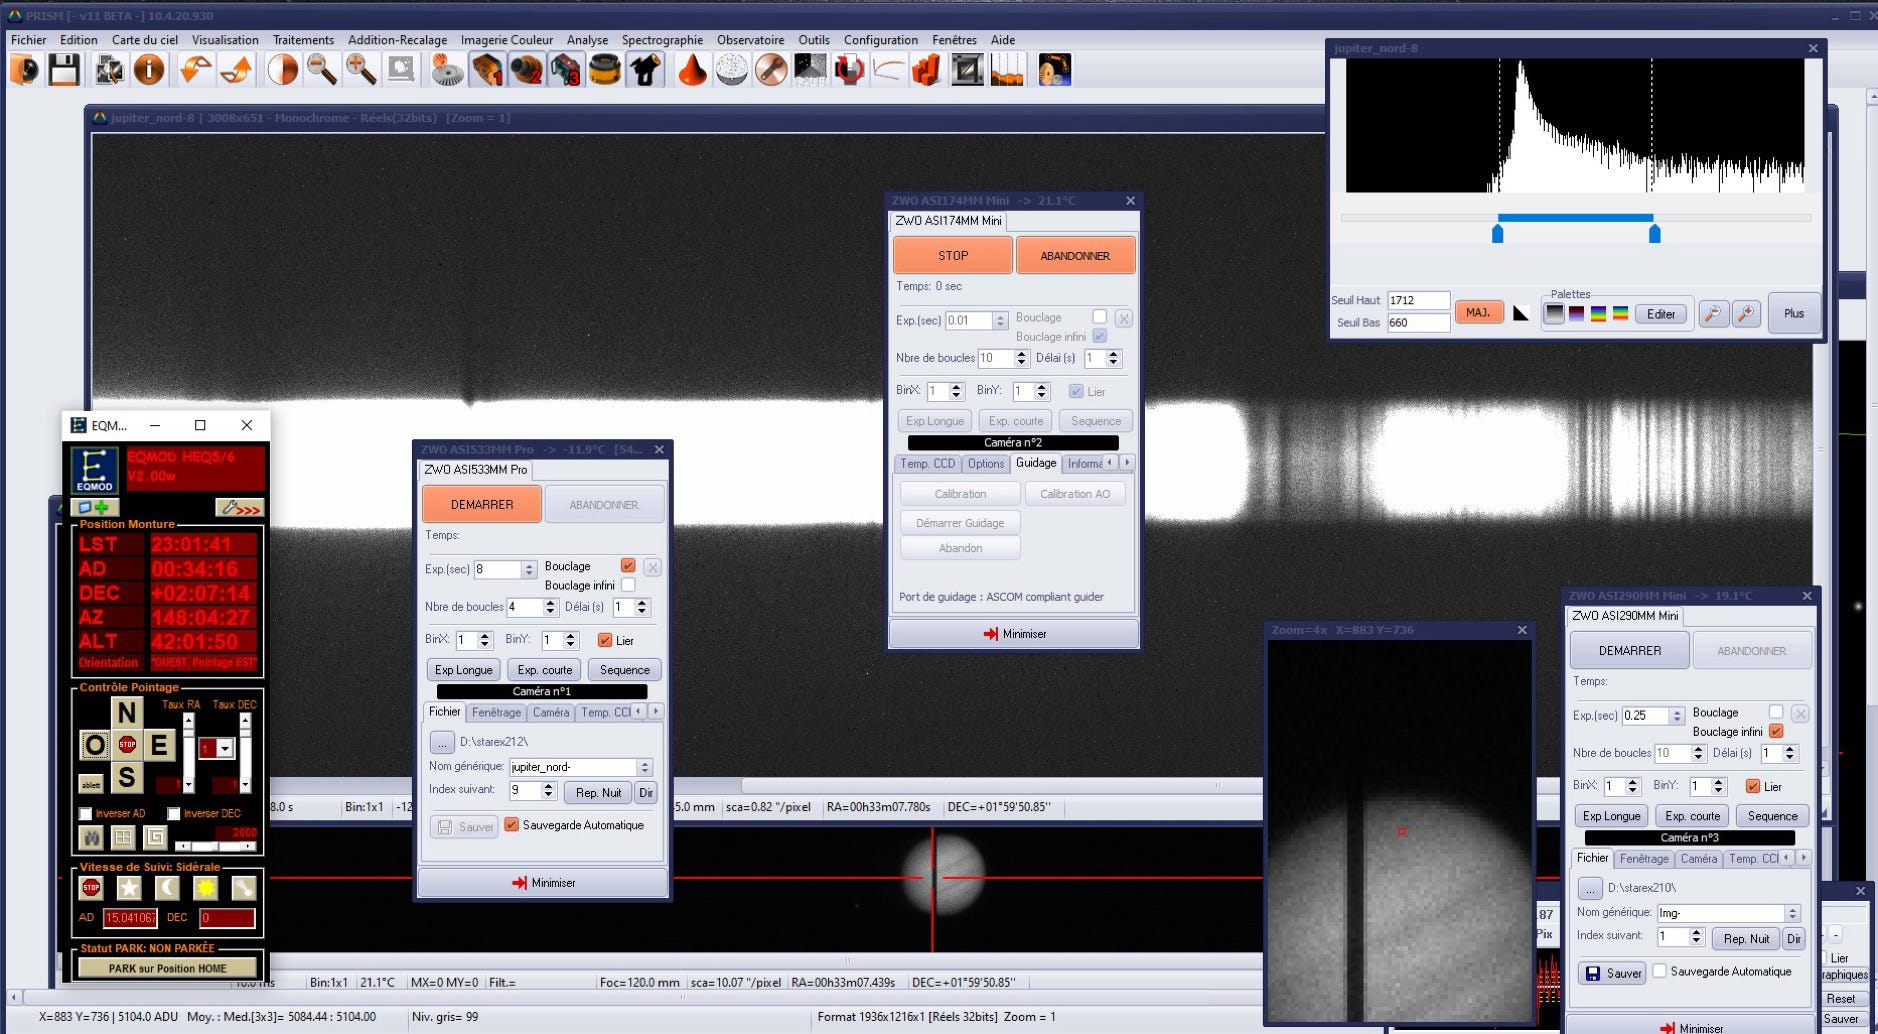
We use here the Prism software for both pointing, guiding and taking the "science" spectra. In the lower right window, we see an image of Jupiter with the 23 micron spectrograph entrance slit that crosses the disk from top to bottom. The slice of light from the disk of Jupiter that enters the spectrograph produces the spectral image visible in the upper part. The spectrum is very broad, because it is that of an extended object (note, the image of the disk is inverted top/bottom with respect to the spectrum).
Hereafter, the spectral profile of the central part of the disk of Jupiter (area of the equatorial band):
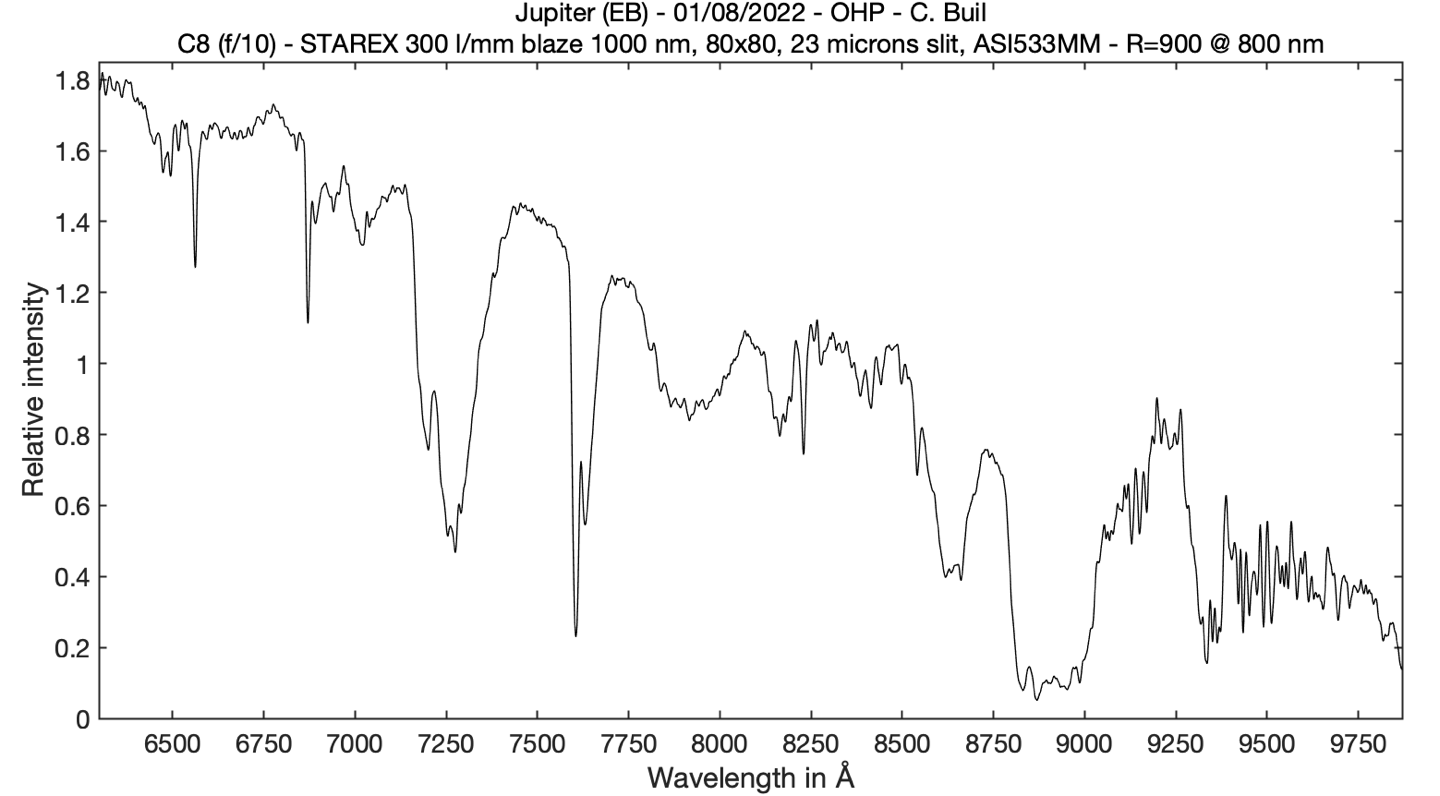
The difference with the spectrum of HD 4915 is immediately obvious: large absorption bands are present in the spectrum of Jupiter, while the light that illuminates the star, that of the Sun, is very close to that of HD 4915. These absorptions are caused by methane (CH4) and ammonia (NH3), the main constituents of the atmosphere of Jupiter.
It is important to understand how the spectrum of Jupiter has been treated, in fact differently from that of the star HD 4915, because in one case the object has a large surface and in the other a point surface. Better still, we did not just plot the average spectrum of the globe of Jupiter, but of a detail of this globe (the EB band). How to do it ?
It is enough to make a very slight modification to the configuration file used to process the spectrum of HD 4915. First, we add the following line in the file:
# ----------------------------------------------------------------
# Vertical coordinate of the spectrum trace
# ----------------------------------------------------------------
posy: 289
In this way, specINTI is forced to consider that the center of the spectrum trace from which we want to extract the profile is at the y = 289 coordinate. If this optional parameter is not specified, specINTI will find the vertical coordinate of the spectrum for you, but since we want to point out a particular detail, which the software cannot know, we impose the vertical coordinate of the trace using the "posy" parameter.
The other modification concerns the binning height to build the spectral profile. Since we want to obtain the spectrum of a detail of the disk, we drastically reduce the binning height to the value 5:
# ----------------------------------------------------------------
# Binning width
# ----------------------------------------------------------------
bin_size: 5
Finally, since the spectrum of Jupiter is very large, we must remember to remove the calculation areas of the sky background signal to avoid the light of the globe, here by doing :
# ----------------------------------------------------------------
# Areas of calculation of the sky background
# ----------------------------------------------------------------
sky: [180, 84, 84, 180]
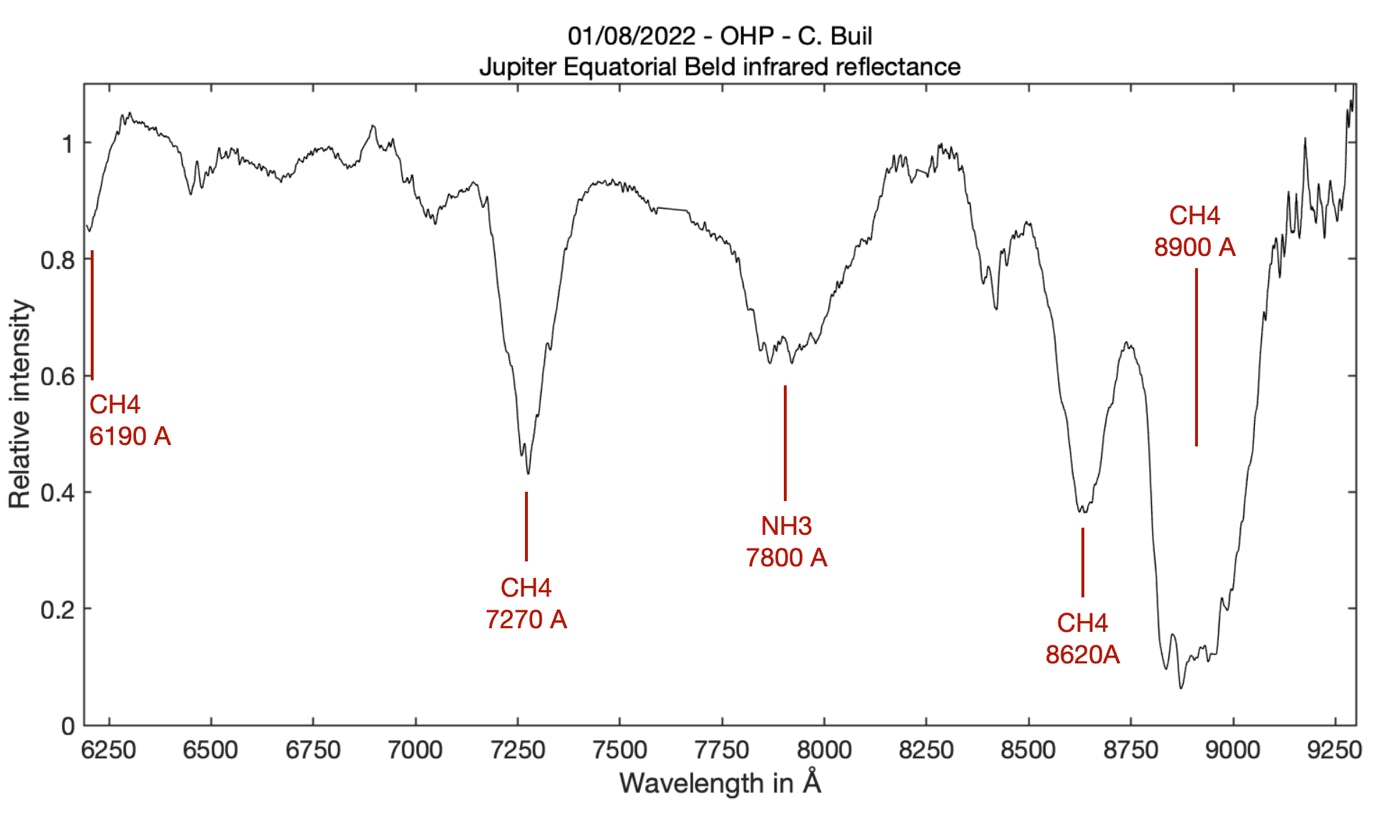
Let's come to a small exploitation of all these results. We have the apparent spectrum of Jupiter (more precisely the equatorial band) and the spectrum of the source that illuminates Jupiter, very equivalent to the spectrum of the star HD 4915. The ratio of the first by the second gives the spectral reflectance of the atmosphere of Jupiter, an important data that allows to determine the chemical composition of it, nothing less. You can calculate this spectrum ratio using software like ISIS or VisualSpec, or from specINTI use the "_pro_div" function by writing in the configuration file something like :
_pro_div: [jupiter, hd4915, ratio]
Here is the result:
Let's take advantage of the fact that it is possible to obtain the spectrum of precise regions of the disk by positioning it with respect to the input slit and by choosing the value of the "posy" parameter. For example, let us examine the image of the spectrum when we are interested in the polar region :
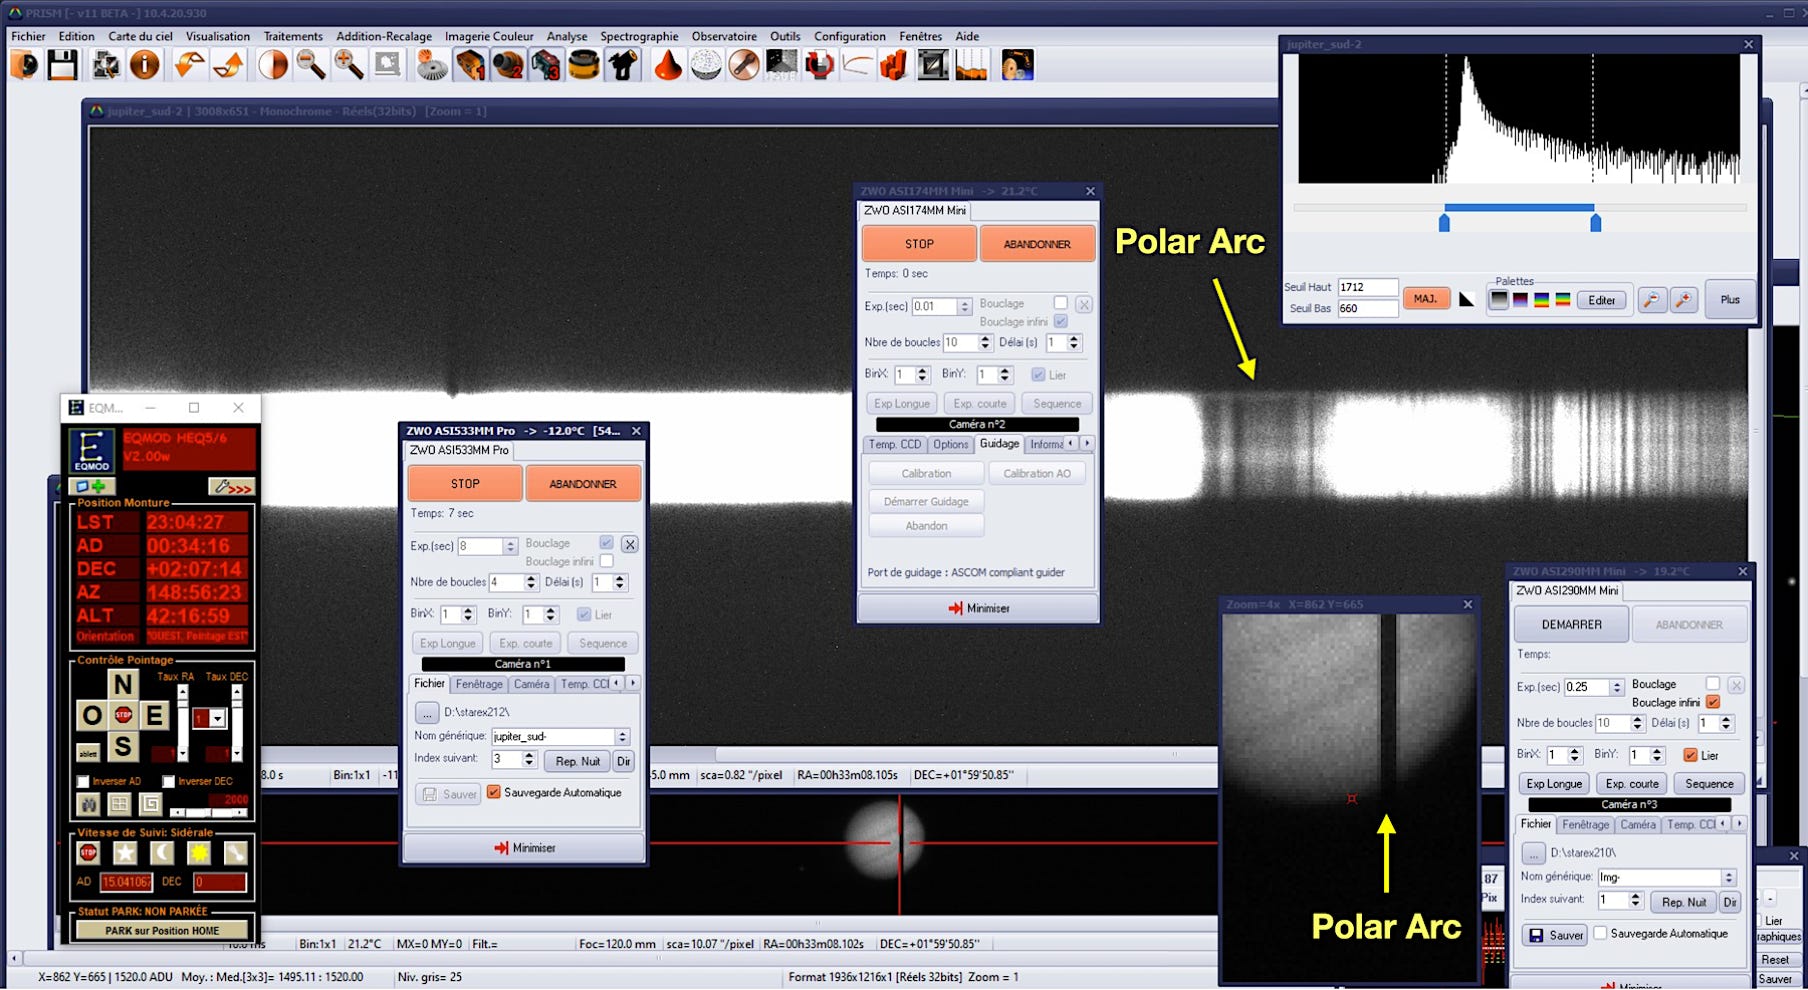
We guess at the limb of the planet, on the side of the pole, an overintensity at the wavelength of the CH4 band at 7900 A. This is the spectral image of the famous polar arc that we can see when we make images of the planet in the "methane". The interest of spectrography is to be able to quantify this phenomenon and to better understand it. Here for example the ratio of the spectrum of the polar region by the spectrum of the northern zone (NZ):
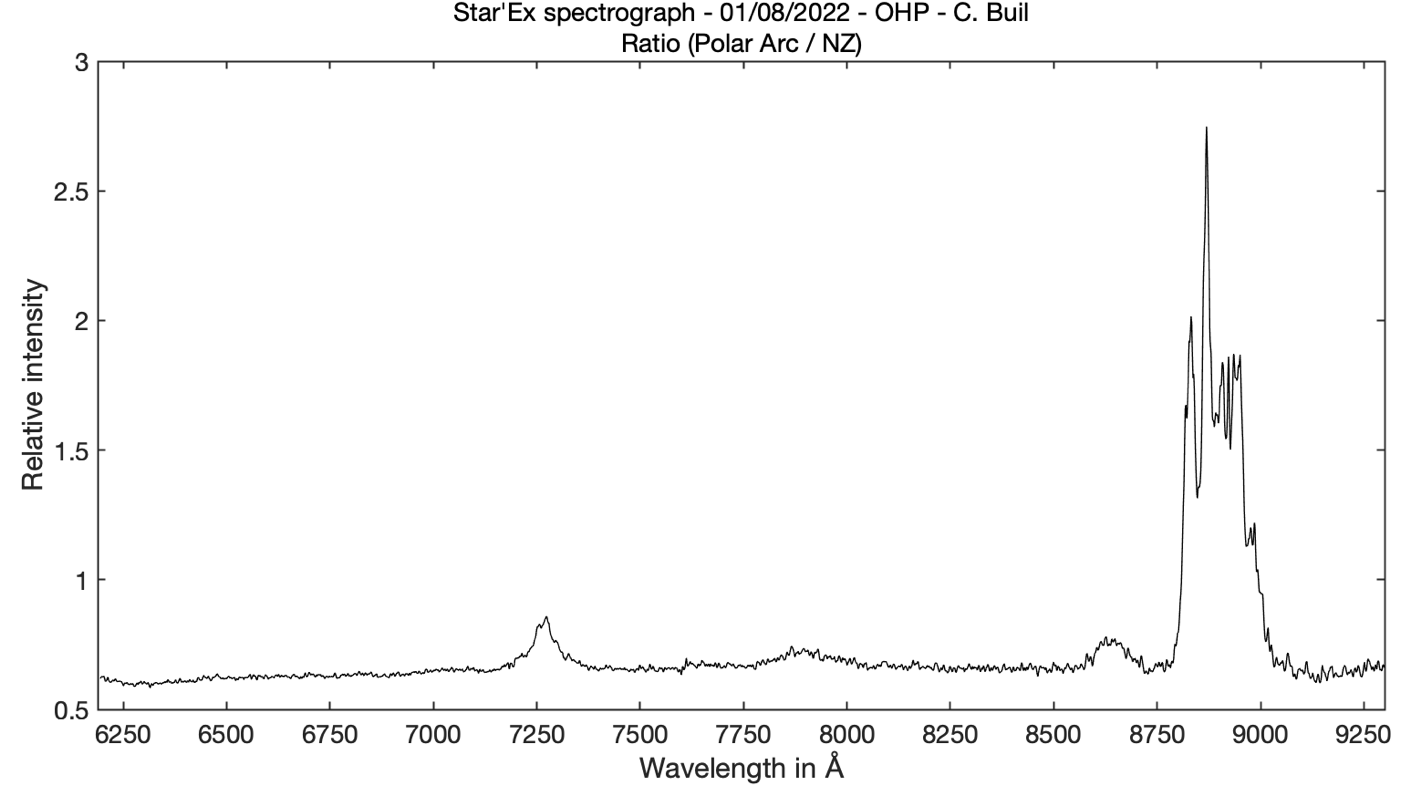
The overintensity of the polar arc at 7900 A wavelength is very well visible. The details in this band are also real.
A point that is very important for this analysis is the use of calibration mode #1. This mode guarantees that the spectral calibration law is the same at all points on the disk. Even if this law is subject to error, the comparisons made between regions are very relevant and accurate. This powerful technique can be used to study the intimate structure of planetary surfaces, comets, galaxies...
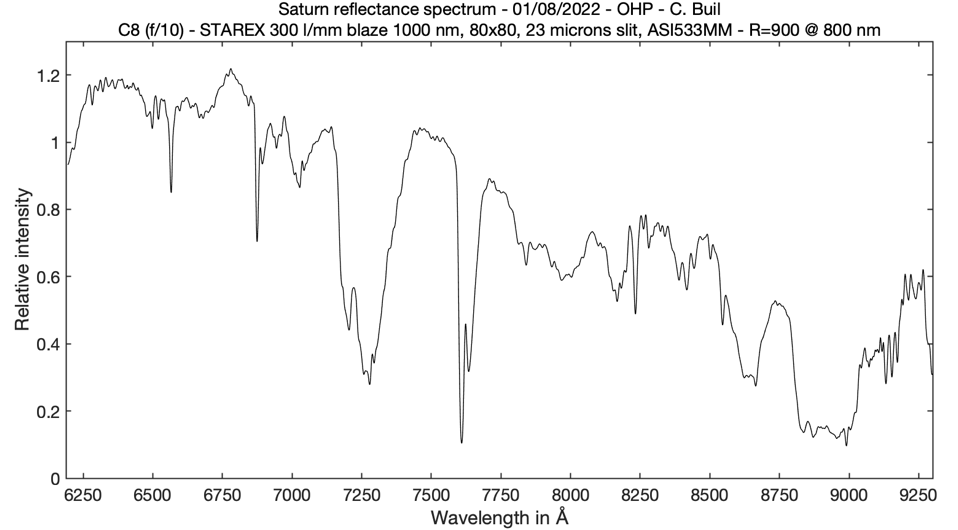
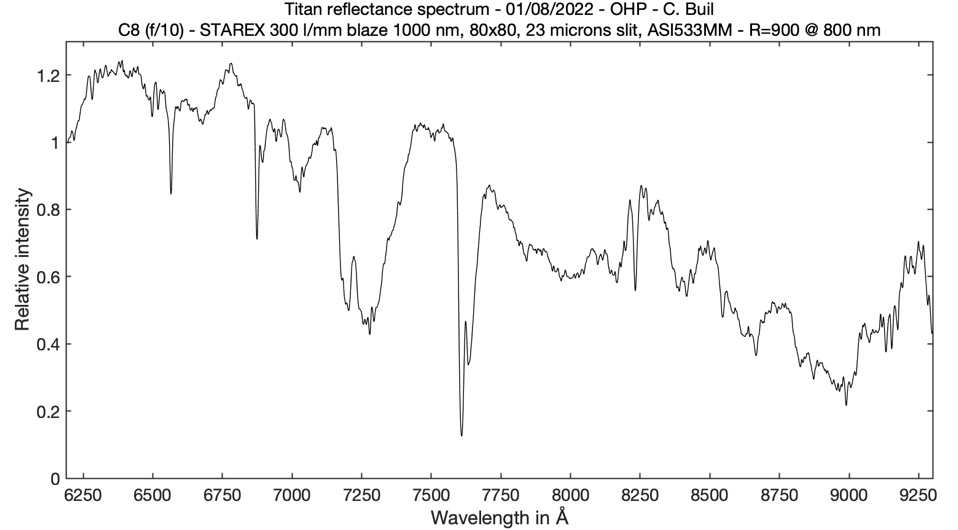
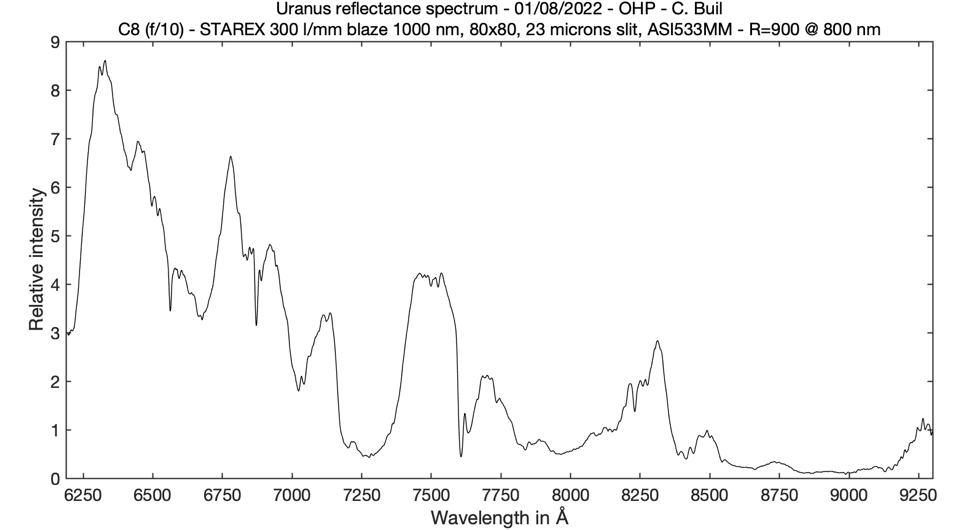
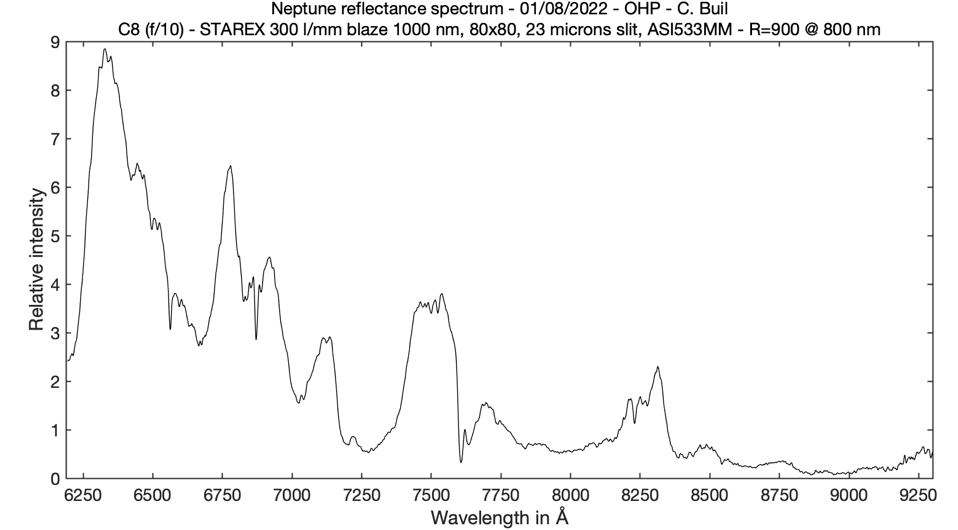
To complete the picture, here is a collection of infrared spectra of distant planets and satellites acquired with the equipment we have described in this section, along with the processing technique. Notice how Uranus and Neptune "glow" like coal in the infrared... :
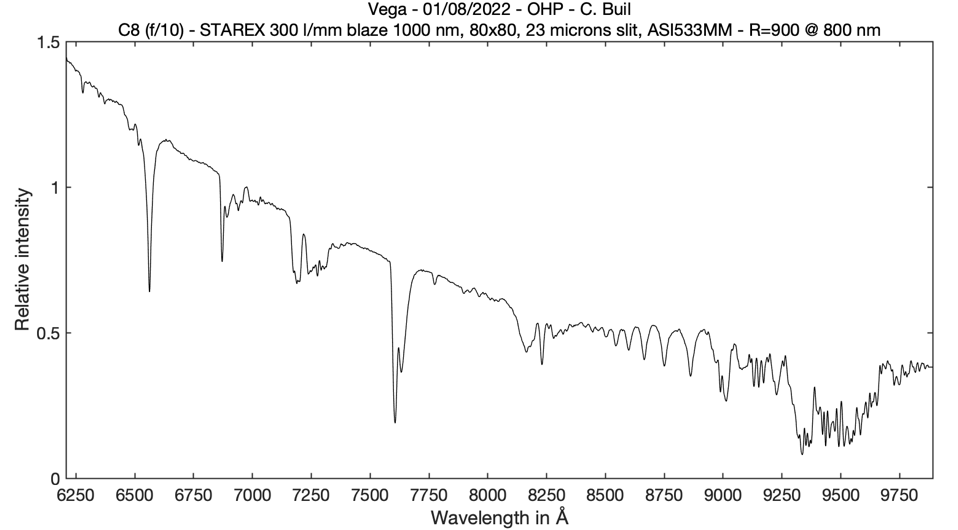
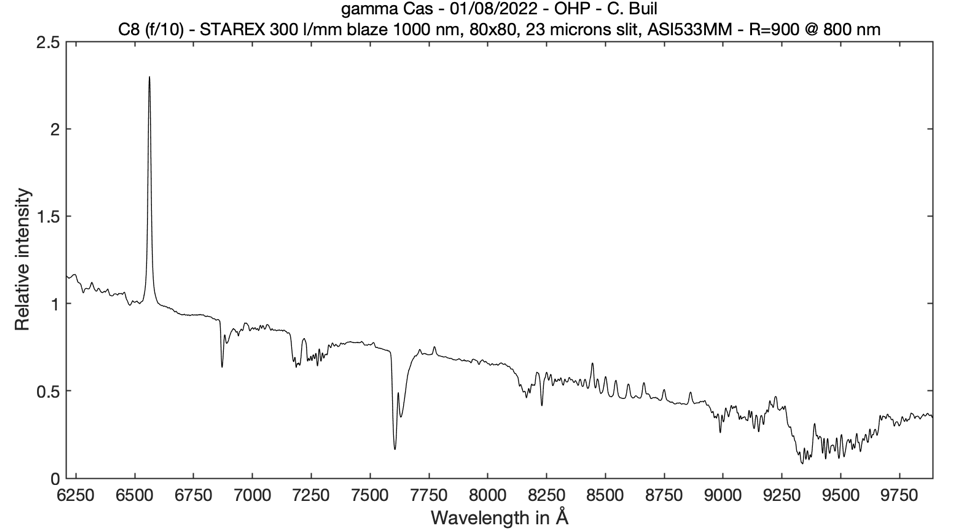
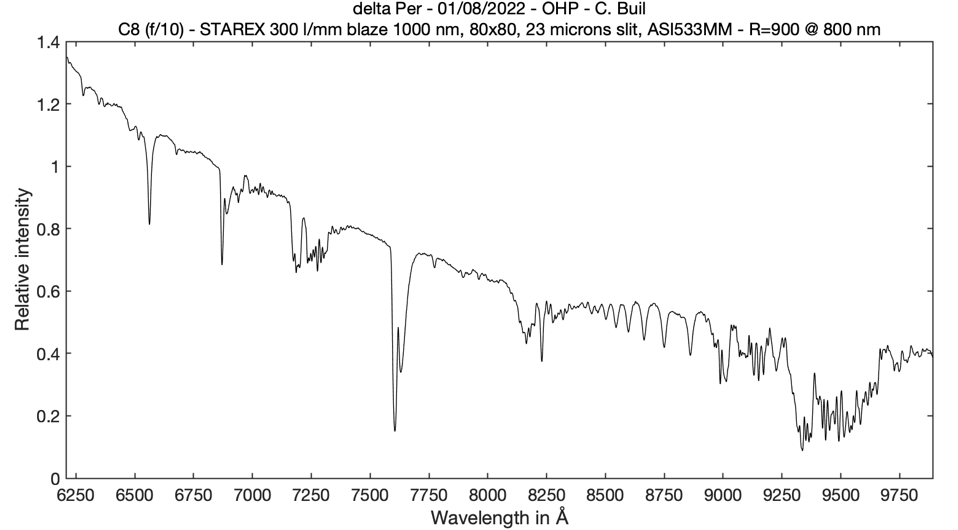
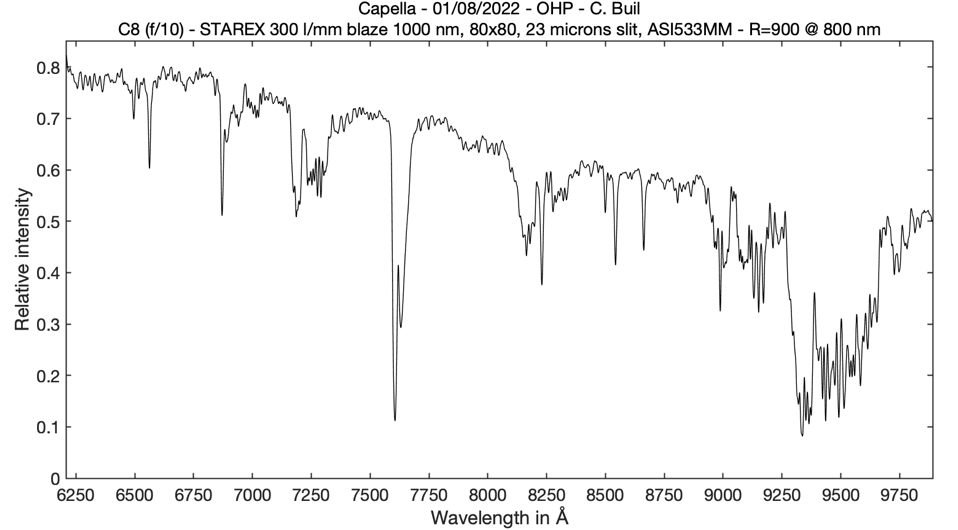
Finally, here are the infrared spectra of Vega (type A0V) and gamma Cas (type Be star, with the Pashen series of hydrogen in emission), delta Per (type B5III) and Capella (G3III), which illustrate the power of this configuration "Star'Ex infrared":